Data Analysis: Statistics analysis (Notes)
Statistics is a language to organize, analyze and interpret numerical data
Statistics can function to
a) Describe data, i.e.
- To explain how the data look
- Where the center point of data is
- How spread out the data may be
- How one aspect of the data may be related to one or more other aspects.
Eg. If you want to describe the total number of pregnancies in the adolescent population, you must calculate:
The average age at the time of pregnancy,
The age range of the group,
The relationship between age at first coital experience and at the time of pregnancy and the number of premarital complications.
You should describe this group of adolescents (Descriptive statistical analysis)
NB: No conclusion can be made beyond this group
Any similarities to those outside (adolescents) can not be assumed
b) The second function of statistics is to inferential statistical analysis
You observe a sample, conclusions about the population are inferred from the obtained information from the sample
E.g. If you were observing the behavior of random sample of adolescent mothers from Moshi Urban.
You could make inference of all adolescent mothers of Tanzania. Here generalization can be made from the sample results.
Inferential statistical analysis
Inferential statistical analysis can be used for estimation and predictions.
E.g. Graduate Examination Records (GRE) can predict how well a candidate may perform in a graduate studies program
Extrapolation is also a component of inferential statistics. E.g. Estimation of Tanzania population in 2020 with current HIV/AIDS prevalence.
Levels of measurement
There are several statistical techniques available to social science researchers who wish to describe the observed research group.
i. Measures of Central Tendency
ii. Measures of Dispersion, spread or variation
iii. Measures of relationship
a) Spearman rank order correlation (rs)
b) Pearson product - moment correlation (r )
It is the responsibility of the researcher to select the technique that best fits her or his data
Measures of central tendency
Unlike the mean, median is not affected by extreme scores
In some instances it can be the more stable measure of central tendency than the arithmetic mean, Our 9 scores with a median of 7 is a good example.
However, it is reserved when a quick measure of central tendency is required to mark the
Skewness of distribution
Mean is the fulcrum or balance point of a distribution and its one of the most useful statistical measures because it provides much information.
It is affected by all scores in the distribution
It serves as basis of further computations such as variability.
Measures of spread or variation
Although measures of central tendency are useful, sometimes we need to know more about the description of the sample or population.
E.g. When comparing two groups with the same mean
Measures of spread or variation
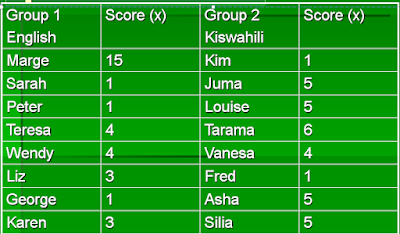
Group 1. ΣX=32; mean is ΣX/n;32/8; mean=4
Group 2. ΣX=32; mean is ΣX/n;32/8; mean=4
When you have similar mean like these, you would like to know the spread of the scores whether similar (homogeneous) or quite different (heterogeneous)
Therefore measures of spread includes:
a) Range basically this is the difference between the highest score and the lowest score in a distribution. It account only the extremes and not the bulk of observations.
From the table above
Group 1. Range will be 15-1=14
Group 2. Range will be 6-1=5
Measures of spread or VariationMeasures of relationship
Correlation coefficient take the values from -1 to +1
A correlation coefficient of zero “0” indicates no relationship
The closer to -1 or +1, the stronger the relationship
A perfect positive correlation (1.00) specifies that for every unit increase in one variable there is a proportional unit increase in the other variable.
A perfect negative correlation (-1.00) concomitantly means that for every unit increase in one variable there is a proportional unit decrease in the other variable.
Perfect correlation are highly unlikely in dealing with human education.
Scatter gram is the means of presentation of the data in correlations showing variables that correspond to the X and Y axis.
The line that you draw to coordinate the points is called the line of best fit or Regression line. (Refer Correlation scatter plots)
You must be careful not to fall into the trap of attributing a course-and effect relationship to variables that might be related
E.g. Kuzma (1984) reported a strong relationship between a child's foot size and handwriting ability. This is not a cause and effect relationship although both increase with age.
Spearman Rank Order Correlation
Spearman Rank order Correlation is used to determine the relationship between two ranked variables (not interval or ratio data)
This is designed for nonparametric data.
E.g. “The relationship between type of family and marital status”
Pearson product - moment correlation (r)
Pearson product - moment correlation (r) is often used for parametric data and is the most precise coefficient of correlation.
E.g. The relationship between age and weight for infants between age and weight. See the MCH card (clinic card)
Early 1990s a statistician named Charles Spearman developed a technique for analyzing ordinal or rank data known as Spearman Rank Order Correlation (rs) which is used to determine the relationship between two ranked variables or ordinal data (not interval or ratio data)
This is designed for nonparametric data only
E.g.. “The relationship between type of family and marital status
1st step - Replace the observations by rank number in ascending order. If two or more variable are equal, find the average rank.
2nd step - Record the difference between the ranks
3rd - Square the differences and
4th step - Sum up the squared differences. See example below. The formula is
E.g. There is no relationship between social rank and skill rank among primary school pupils in Ipagala primary schoolFrom the answer above, then we would like to know whether or not the difference between social rank and skill rank is significantly from 0, rs = 0.648 for 10 pupils
There is a rs critical table to compare the answer. See Table C is the answer significantly different from 0 at 0.05 level of significant?
i. At 0.05 = rs 0.648
ii. Since our rs observed is 0.89 > rs 0.648 from the table, we would reject the null hypothesis.
We conclude that a correlation coefficient of this size = 0.89 did not happen just through sampling error, and we would then state that it is significantly different from 0 at 0.05 level of significant.
In terms of the study, we would conclude that
“A relationship exist between social rank and skill rank, those pupils with high scores in social had better scores in skill”
iii. As the relationship drops, the differences and ΣD2 increase and rs of course gets smaller
iv. Finally when there is a negative correlation, the difference and ΣD2 are very large indeed so that the fraction to be subtracted from 1 is greater than 1, resulting in a negative rs
NB: However, this outcome does not necessarily imply a cause and effect relationship.
Karl Pearson (1857-1936) was an English Statistician who derived Pearson product - moment correlation( r)
Often used for parametric data (interval or Ratio) and is the most precise coefficient of correlation.
For example
a) The relationship between height and weight for infants
b) There is no significant relationship between SE 301 and SE 300 among UDOM third year students.
Relationship between Mathematics and Civics
Performances among Makole standard 5 pupils
Pearson product - moment correlation (r) Formulae
Meaning of r significance
The r observed is =0.02 we compare it with r critical from table B
Our df is N-2; 10-2=8 at significant level of 0.05
r critical is 0.632
r observed 0.02 < r critical 0.632 at 0.05 significant level
Hence, we accept the null hypothesis that “There is no relationship between mathematics and civics performances among Makole standard 5 pupils.
Other standard scores
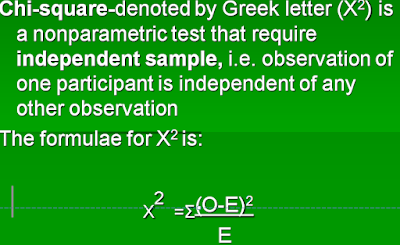
Chi - square is a technique that can determine whether or not there is a significant difference between Observed frequencies and Expected (theoretical) frequencies in two or more categories
E.g. Suppose you flip a coin 20 times and record the observation. From law of Probability we should expect 10 heads and 10 tails. But because of sampling error we could come up with 9 heads and 11 tails; or 12 heads, 8 tails
Chi - Square (X2)
What does a chi square of 0.8 mean?
The degree of freedom is rows-1 i.e. (2-1=1)
Look at Table F we see that a X2 is 3.84 at df 1 or greater is needed to be significant at 0.05 level
The X2 of 0.8 in coin flipping experiment happened due to sampling error,
We conclude that the deviations between the observed frequencies and expected frequencies are not significant.
Students with learning disabilities have large standard deviations. See the example below
Note that again df is (r-1; 2-1) 1. Table F df 1 indicate X2 must be equal or exceed 3.84 to be significant at 0.05 level
Since our calculated is 6.36 > 3.84 at p = 0.05. We conclude, there were significant difference between the low achieving and learning disabled students
Lets compare more than just two categories
Chi - square X2 Distribution
X2 (4) =18.02 P >.01
Results show that X2 is 18.02 and the df (r-1 i.e. 5-1)=4
From Table F a X2 of 18.02 or greater is needed for X2 to be significant at level 0.01. So we conclude that the leaders` score distribution deviates significantly from a normal distribution.
Other standard scores
Z - score is simply a way of telling how far a score (or individual) is from the mean in standard deviation.
E.g. If you was calculating the standard deviations of height of standard one pupils (in cm), then the Z - score will be given in cm
Inferential analysis
Inferential analysis is when you use data from a sample to make inference to the population.
Eg. Results from a study done in Songea Boys Secondary students you infer to all secondary school students in Tanzania
Testing Statistical significance
When analyzing data using inferential statistics, two procedures can be done.
Testing hypothesis which is commonly used or
Estimating parameters (confidence interval - CI), is used when we do not have value of a population characteristics.
Estimating parameters
Constructing a CI around a sample mean establishes a range of values for a population parameter in addition to a certain probability of being correct.
Usually the CI is arbitrary, and researchers used either 95% 0r 99%
This means the researcher allows an error of 5%(0.05) or 1% (0.01) only.


Post a Comment